
IREN Earnings Volatility Side-Eye
Iris Energy through the lens of dealer flow optics

Iris Energy $IREN has given me an eyeful for the past 2 weeks. So let’s focus in on the volatility and dealer flow to understand how options greeks illuminated the path forward to managing risk and maximizing profitability.
Iris Energy has an eye-watering implied volatility, so of course it is both risky and fun to trade. It tends to touch support before testing the upper limits of dealer positioning, but good luck attempting to time it! I’m not brave enough to short an AI name right now, but there were plenty of opportunity for long and short traders to make profits.
Disclaimer: NOT FINANCIAL ADVICE.
I’m NOT a financial professional. Make good choices people! This information is for moral support, intellectual stimulation, and educational purposes only; this does not constitute financial advice. Trading stocks and options involves risk and are not suitable for all investors as the special risks inherent to trading may expose investors to extreme loss. Learning is expensive.Before you blow up your account and shame yourself, consult with a qualified financial professional to receive personalized advice tailored to your specific needs. I hope this post inspires you to learn more!
NOTE: The levels below contain outdated vanna and gamma information. They have not been updated for the second week of November. The data below is to illustrate the power of using greeks in a day trade or swing trade context. Out of respect for Vol.land’s powerful proprietary dealer positioning tools, my substack articles are retrospective.
On 10/27/2025, I shared this observation in the Volland discord:
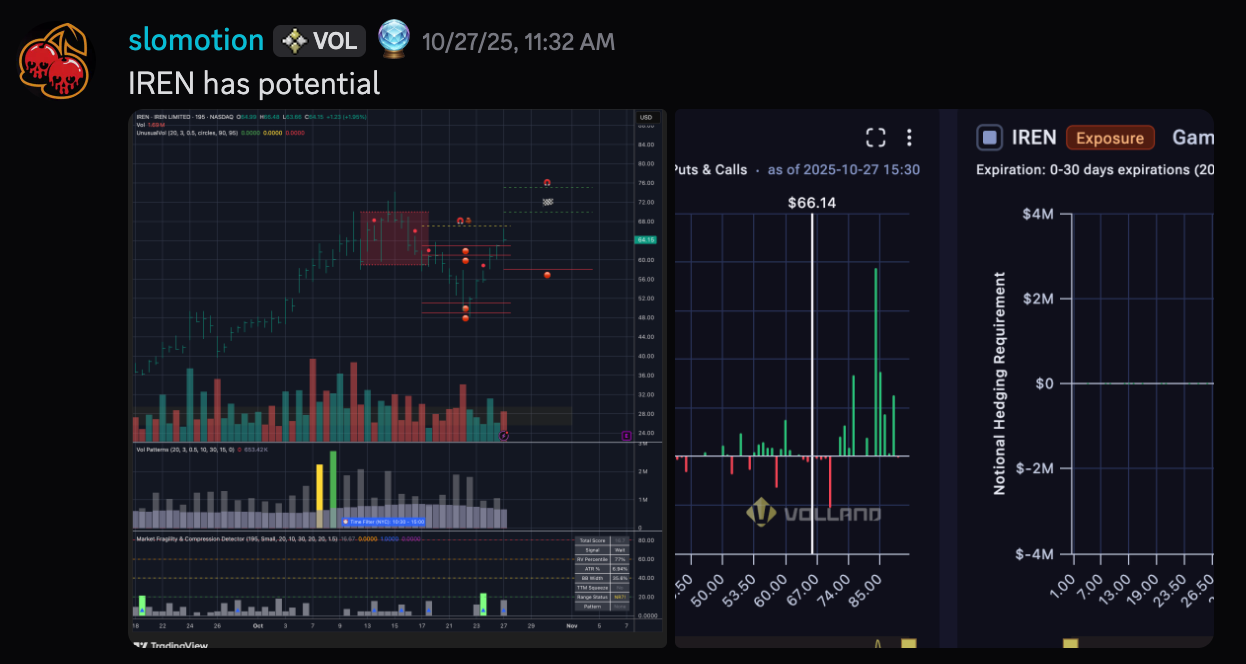
In the last week of October, I observed that IREN tested and respected dealer support levels below spot. By Monday October 27th, IREN broke through the upper dealer levels and continued to extend. I saw 30-day options vanna and gamma data showing that in the context of increased volatility, IREN could draw down 10% to the $58 or $60 price level. The data also suggested that if IREN hit $70, it would have the opportunity to reach $75. However, those mid-70’s promised some “drama” due to opposing vanna and gamma positioning.
Below are the images I shared on Monday October 27th:


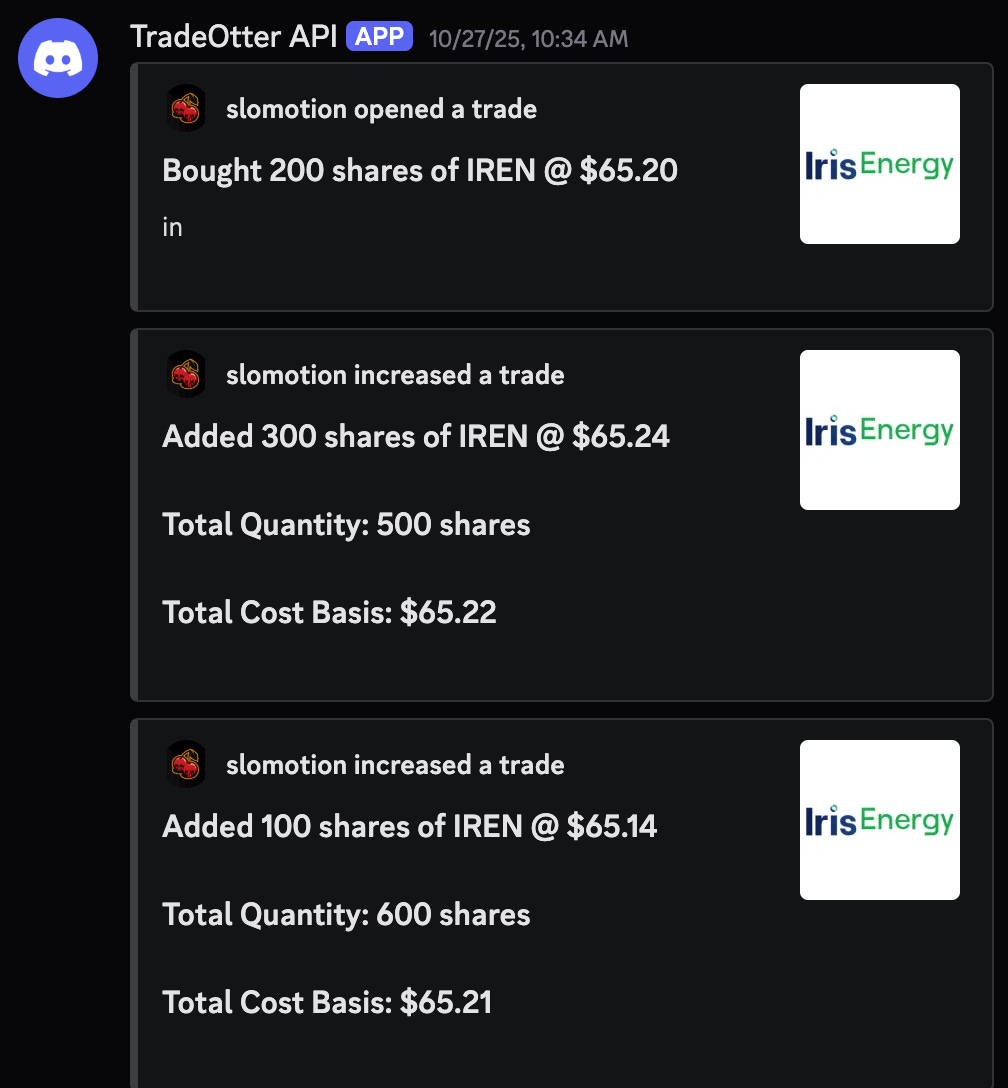
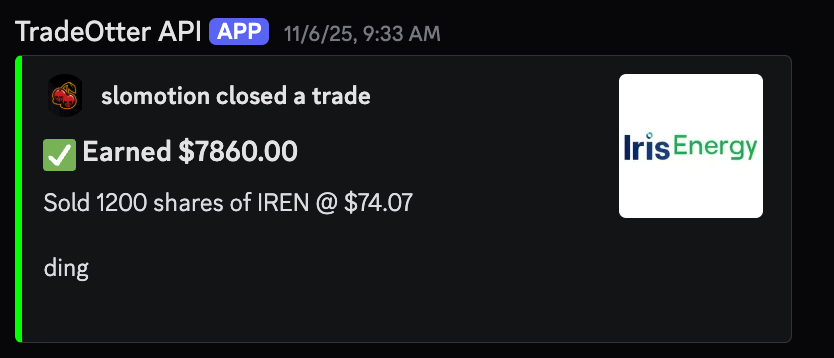
Talk is cheap and actions speak louder than words, so I bought. Here’s the live trade info courtesy of TradeOtter:
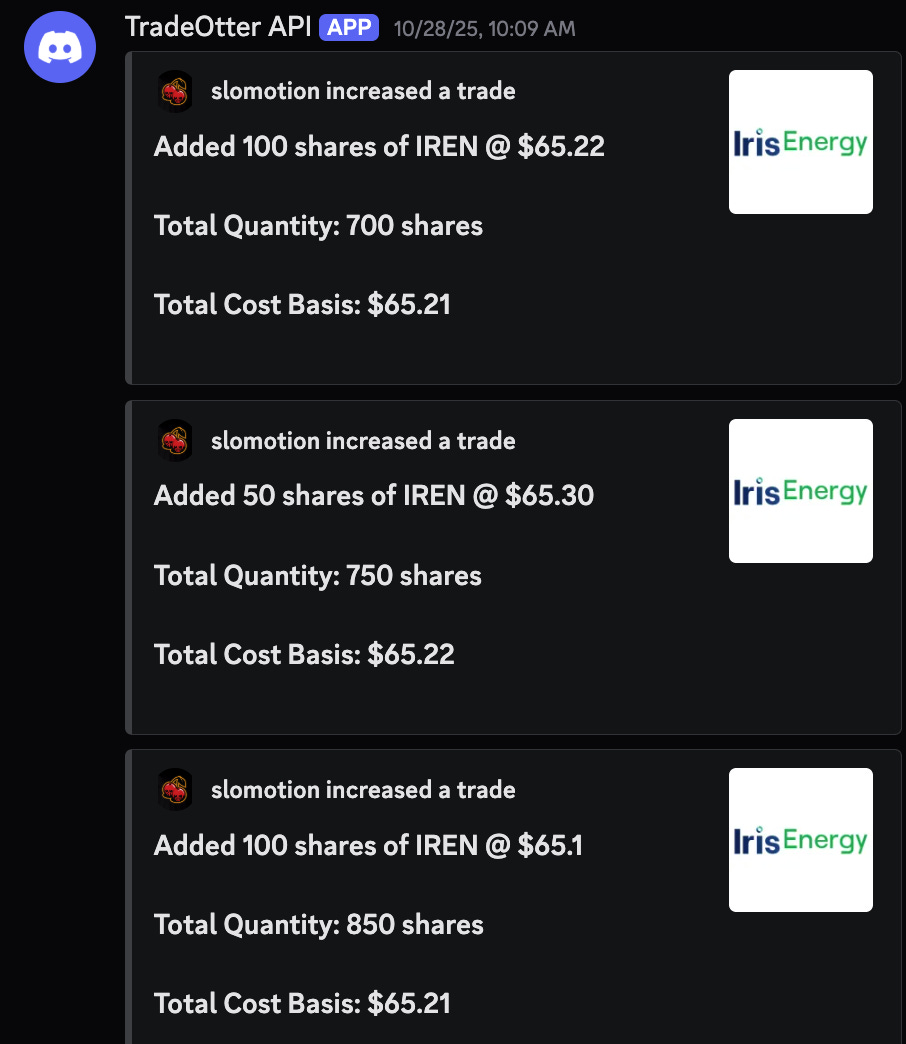
By October 28th, I noted bullish dealer gamma notional nearly doubled above spot while bearish notional nearly halved, but the options strike positioning remained the same.
So I bought some more:
Well that certainly is a decent lot size! My confidence was high which meant the market needed to knock my ego down a few pegs. The market moved against me and I was bleeding money for two days. My weak hands were trembling and I felt twitchy. I needed help to keep my trigger finger away from the sell button.
During the October 30th premarket, the greeks offered the hopium I needed. There was a character change in options positioning at the $58 gamma support. The $58 strike position increased almost 5-fold from Oct 27th to October 30th. We had a wide band of negative gamma notional hedging requirement above spot. At a glance, I could see an overall positive cumulative vanna. That’s a clear narrative: If volatility allowed, an increase in price could trigger more dealer buying.


On October 30, IREN hit an intraday low of $57.30 before closing at $58.22. That’s a 12% drawdown in a couple days, but the dealer support at $58 still stood.
On Sunday, Nov 2nd, I checked the greeks on Volland again and came away with this impression:


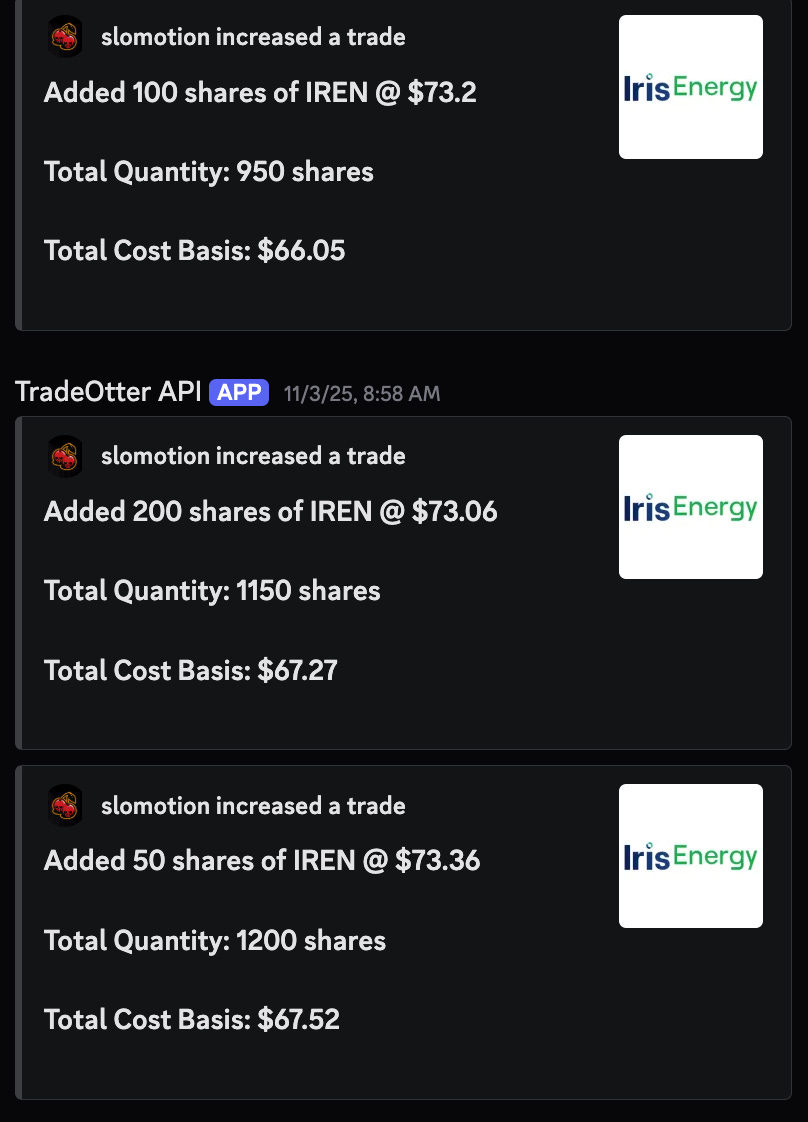
I liked the large new negative vanna below spot showing confluence with gamma support. I was optimistic but I was not prepared for what happened Monday November 3rd: IREN hit an intraday high of $75.73 which was a 24.7% increase from the previous session’s close!
So I bought some more:
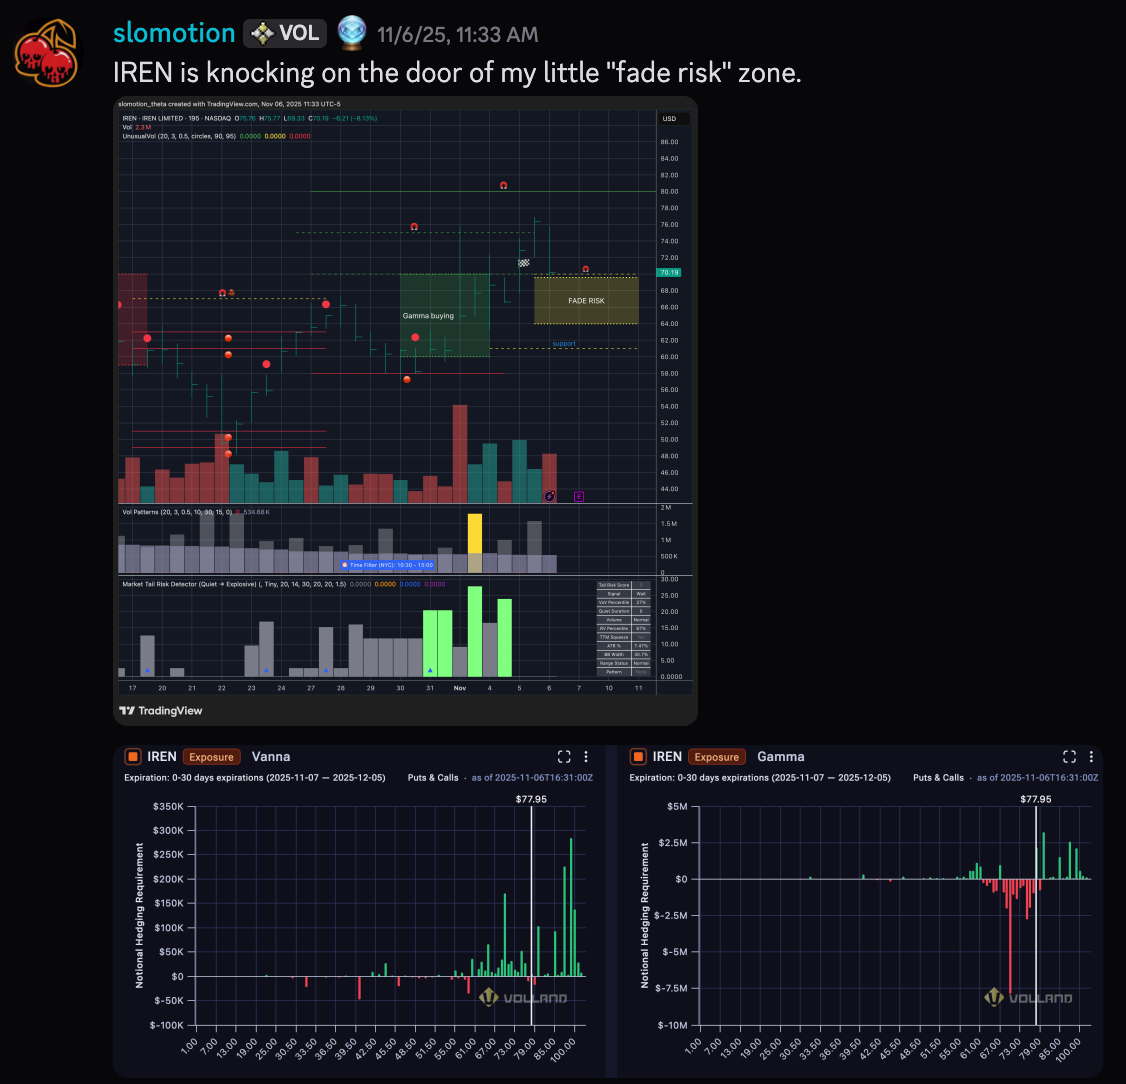
There was some shakey price action the next few days and on November 5th I noted the following, “The 76 vanna level has flipped negative above spot. Gamma is still favorable. But we now have a decent fade risk.”

IREN did reach an intraday high of $76.87 on November 5th, but I was not happy with the setup. Premarket on November 6th, I noticed that options positioning support was not “following the price action.” Like a climber with too much slack on a belay rope, a drop would fall a considerable distance before support would catch us.
So on market open on November 6th, I sold at $74.07 for a 9.7% gain in 10 days. I was unwilling to risk earnings that evening. IREN continued to slide the same day I sold and closed at $67.19 (a -12.37% drop for the day).
My goal for this article was to demonstrate how options greeks improved my trading workflow and peace-of-mind. I needed the options data to walk through the Iris Energy pre-earnings minefield. I hope you learned something new!
“Volatility exposes us to large moves down AND up. Times of uncertainty can offer new opportunities if we keep our eyes open and look for those green shoots of hope.”
Good luck and good trading!
Resources and Acknowledgements
Options Data:
For years, I’ve subscribed to Vol.land’s dealer positioning data.
Out of respect for Vol.land’s powerful proprietary tools, my substack articles are retrospective. Vol.land offers free instructional videos and educational resources, plus a large discord community. I contribute near real-time observations on Vol.land’s discord.
Disclosure: I’m a Vol.land affiliate. Coupon code “Envelope5” gives you a 5% discount on Vol.land’s subscriptions. Using the coupon also gives me a little guacamole.
Trade Logging:
I’ve traded with an open book from 2020-2025. Every trade is public, even the really really stupid ones. I’m currently using TradeOtter, which is under development by my friend (and fellow options trader) Joonie. I’m also a member of the Thetagang.com discord community.
Technical Indicators:
Tradingview indicators are authored by Major, the Thetanerd via Github. He deserves a cup of coffee or bottle of hot sauce for his work!
Excuse the typos, I don’t use AI to write.
Thanks for writing this, it clarifies a lot. Your breakdown of the greeks really helps connect the dotts from your last article on AI volatility. Very insightful.
The dealer flow anaylsis really shows how volatilty can be your freind if you understand the greeks. That 24.7% pop into earnings was insane and your disipline to lock in profits around $74 was smart. The way vanna and gamma positioned around the $58 level gave some clear entry points.